Toggle navigation
About me
Learning Data Science
Projects
Portfolio Website
Coding Disciple
A journey of learning and self development
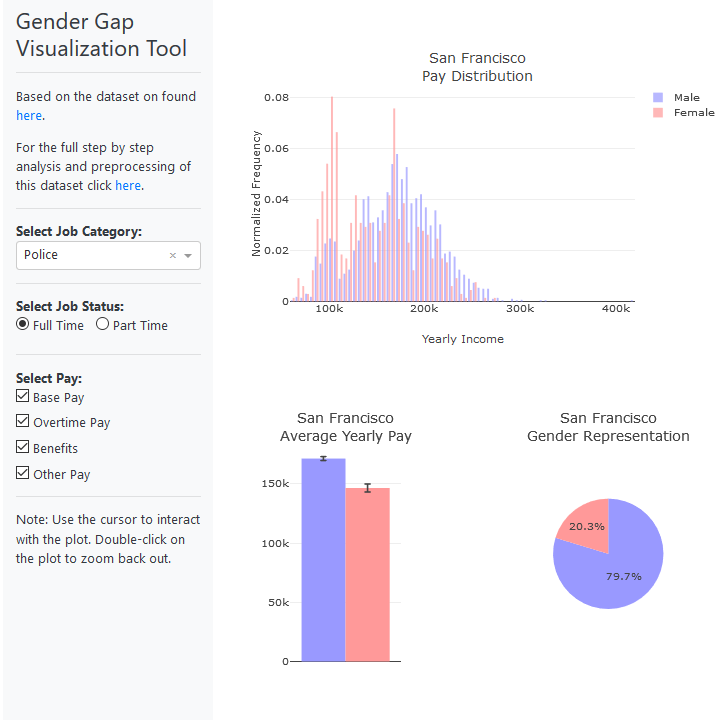
Investigating the Gender Wage Gap
Solving the Monty Hall Problem
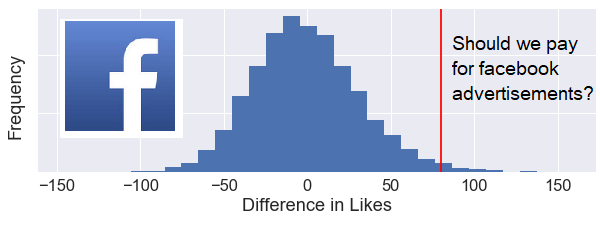
Bootstrap Confidence Intervals and Permutation Hypothesis Testing
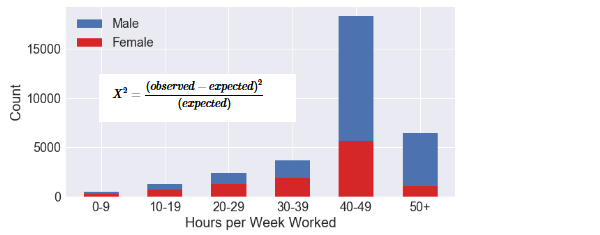
Chi-Squared Test for Independence in Python
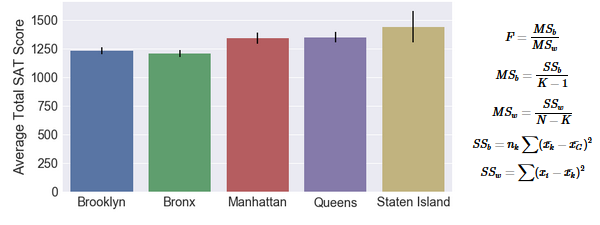
Hypothesis Testing with ANOVA in Python
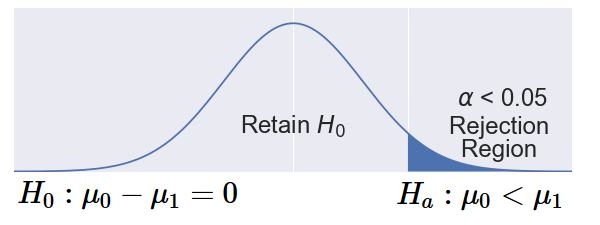
Hypothesis Testing with Welch's t-test in Python
Business Oriented Data Analysis with SQL and Python
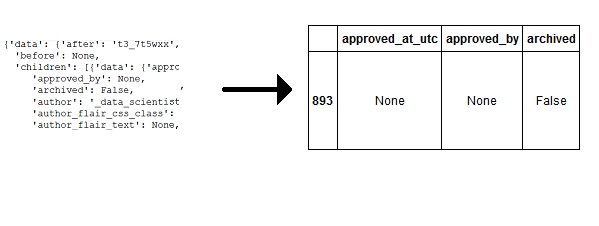
Scraping Reddit Data to a Pandas Dataframe
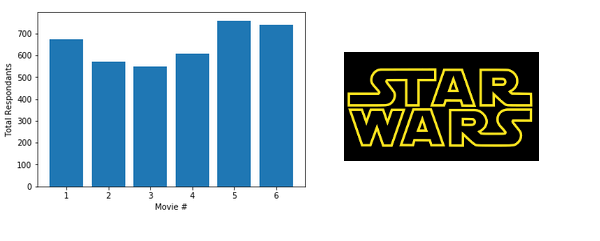
Analyzing Star Wars Survey Data
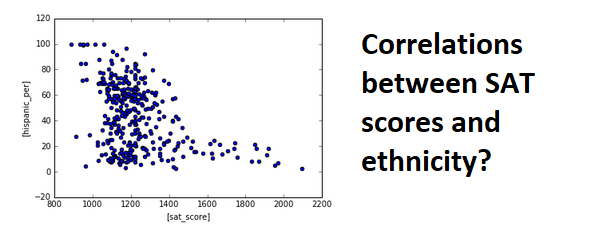
Analyzing High Schools in New York City
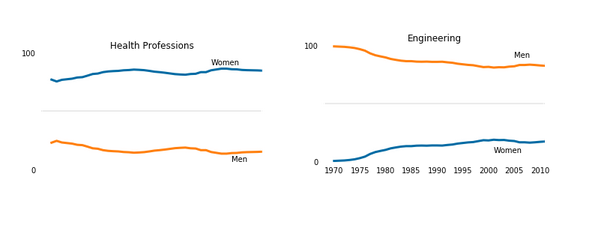
Visualizing The Gender Gap In College Degrees
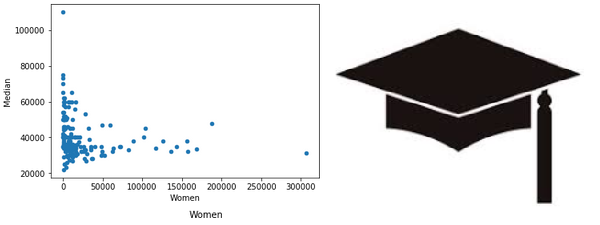
Visualizing Earnings Based On College Majors
Analyzing Thanksgiving Dinner
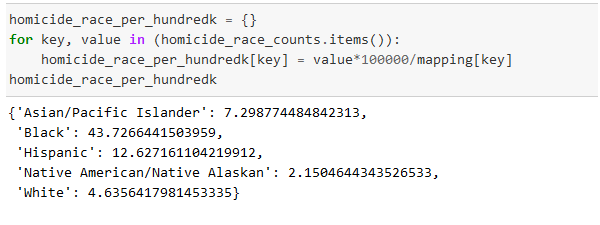
Exploring Gun Deaths in the US
Exploring U.S. Births