Toggle navigation
About me
Learning Data Science
Projects
Portfolio Website
Coding Disciple
A journey of learning and self development
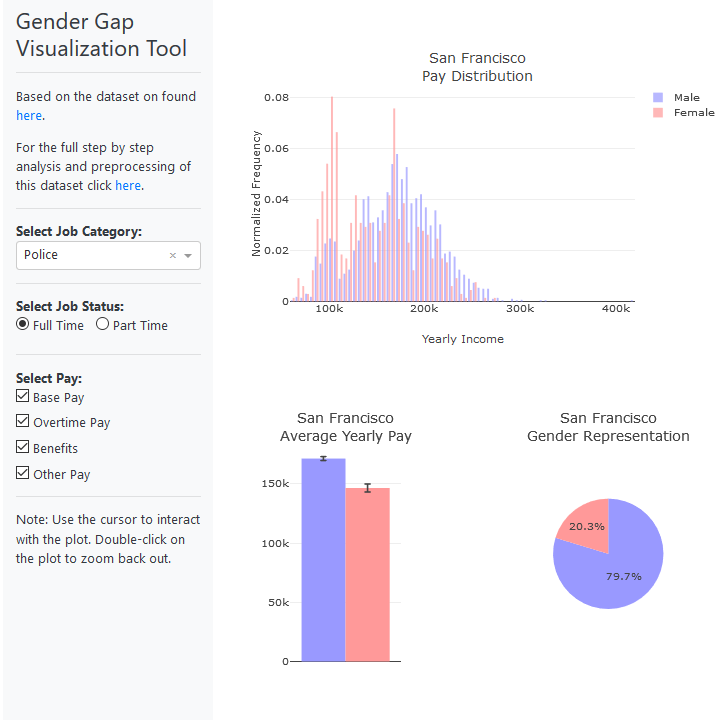
Investigating the Gender Wage Gap
Solving the Monty Hall Problem
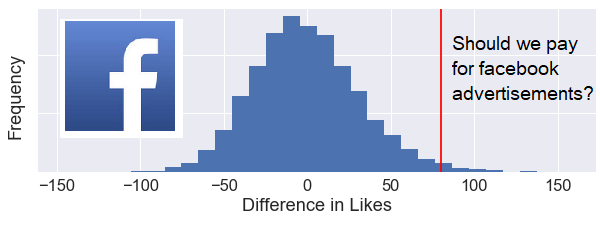
Bootstrap Confidence Intervals and Permutation Hypothesis Testing
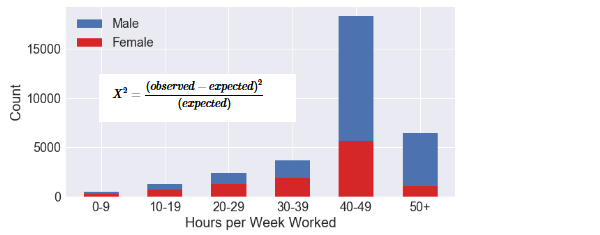
Chi-Squared Test for Independence in Python
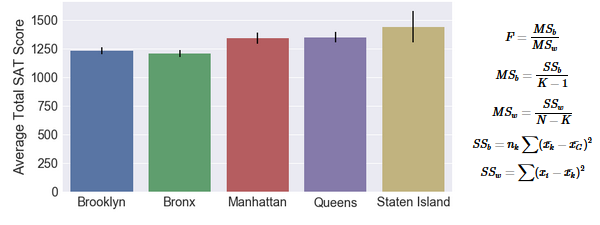
Hypothesis Testing with ANOVA in Python
Hypothesis Testing with Welch's t-test in Python
The Normal Distribution and the Central Limit Theorem - Applications to Data Science
Understanding Dispersion
Understanding Central Tedency
Business Oriented Data Analysis with SQL and Python
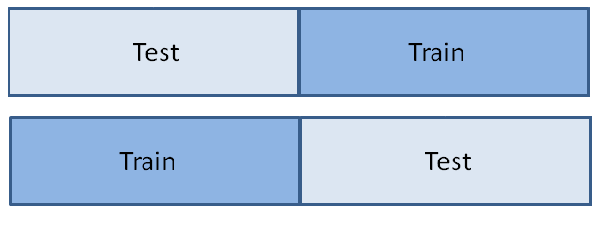
Cross Validation Methods for Machine Learning
Predicting Bike Rentals with Decision Trees
Analyzing Jeopardy Data
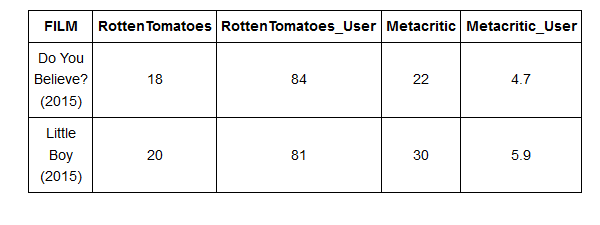
Comparing Movie Review Websites
Analyzing CIA Factbook with SQL/Pandas